Inside the SCA Structure Break Indicator
- 5 days ago
- 4 min read
Free tool · Swallow Crypto Academy
Most traders lose the trend in the noise. Price is breaking levels constantly, and it's hard to tell which break actually matters. We built the SCA Structure Break Indicator to do one job, cleanly: mark the moment price breaks a confirmed swing point — a Structure Break — so you stop guessing where structure shifted and start reading it.
This post shows what the tool does, how to set it, and — just as important — how we read its signals with our Setup 1 & 2 framework (Members only), because not every break is a real one.
What a "Break" is
A swing high is a peak with candles on both sides; a swing low is a valley. When price closes back through one of those levels, the structure that was holding has broken. The tool watches every confirmed swing and draws a line the instant one breaks, with a simple "Break" label.
Green = an up-break (price broke a swing high)
Red = a down-break (price broke a swing low)
By default, breaks are colored by direction (green up, red down). You can also switch to coloring by type in the settings — continuation (the break goes the way the trend was already going) versus reversal (the break goes against it) — so you can see at a glance which breaks extend the move and which ones turn it.

What the tool draws — and what it doesn't
One thing to be clear about, because it matters when you add the tool to your own chart: the indicator draws the Break lines and labels. That's it. The shaded boxes, the "break zone," the "support on bigger timeframe," and the trade notes you'll see in the next charts are things we draw on top — that's the Setup work, the human read. The tool flags the level; you and your playbook decide what to do with it.
That separation is the method: an objective signal first, your judgment second.
The only two settings you need
Ignore the cosmetic stuff (colors, labels, line width). Two settings actually change the signal:
Pivot strength — how many candles sit on each side of a swing. Higher = bigger, rarer breaks (cleaner, slower). Lower = more, smaller breaks (faster, noisier). This is your main dial. We run 5 on the 4H as a starting point.
Breakout confirmation — Close versus Wick. Close means a candle has to actually close beyond the level for it to count. Wick means a poke through is enough. Close is stricter and filters a lot of junk; Wick is earlier but catches more fakeouts. We trade Close.
That's the whole tool. Two dials.
How a break "zone" forms
This is where the signal turns into a trade idea. When a break prints and a following candle confirms it — closes beyond the level as well — we treat that broken level as a real break zone and look for an entry back into it. This is our read, not something the indicator draws — the tool only marks the break; we add the zone. The tool's Close confirmation setting works on the same idea: it only marks a break when a candle closes through, not when price merely wicks past, so the breaks it shows are already the cleaner ones.

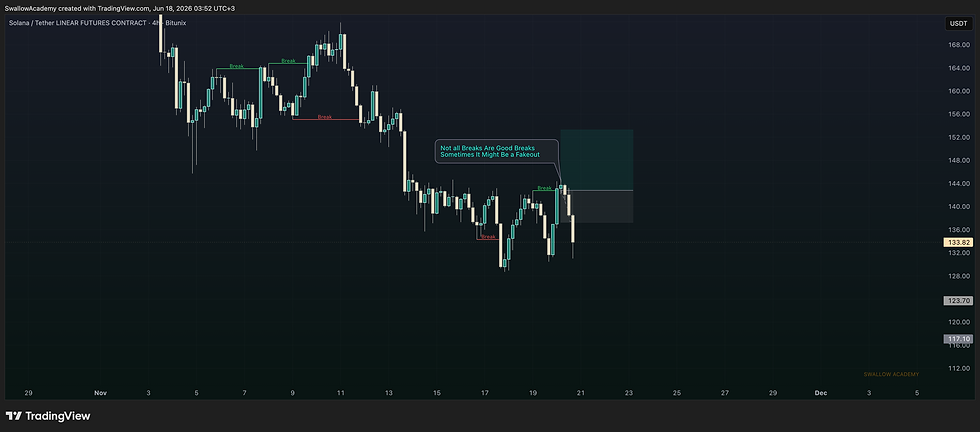
Not every break is a real break
This is the honest part, and the most important one. A break is not a guarantee. Some breaks are fakeouts — price pokes through, triggers everyone, then snaps back. If you trade every single Break the tool prints, you'll get chopped up.
So how do you tell a real break from a fake one? That's not something a line on a chart can do for you. That's what our framework is for.
Where Setup 1 & 2 come in
The indicator marks where structure broke. Our Setup 1 & 2 playbook is which breaks to act on — how confirmation, higher-timeframe context, and location separate a real break zone from a trap, and how we structure the entry, stop, and target around it.
That part is what we teach inside Swallow Crypto Academy. The tool is free and does its job on its own chart; the edge comes from how you read it.
How to add it (free)
The SCA Structure Break Indicator is free on TradingView:
Open TradingView and search our profile: SwallowAcademy.
Open the {SCA} | Structure Break Indicator Post (https://www.tradingview.com/script/8DFe8yjh-SCA-Structure-Break-Indicator/).
Click Add to chart. Set Pivot strength and Close/Wick to taste.
A note before you trade
This indicator is a tool for analysis and education. It is not financial advice and it does not predict price. No indicator wins every time — the SCA Structure Break Indicator marks structure objectively, but your risk management and your read decide the outcome. Trade your own plan.
- Swallow Academy
Telegram: https://t.me/SwallowCryptoAcademy
Where We Trade (Bitunix | -10% Off Trading Fees For Members + VIP3 at start): https://www.bitunix.com/register?vipCode=SwallowAcademy
Which Prop Firm We Use (HyroTrader | -10% Off Challenge): https://www.hyrotrader.com/?coupon=SWALLOW


